Right now (April 27), the JHU data on new COVID-19 cases in the US show a very distinct weekly rhythm; reports are lowest on the weekends and peak in mid-week. This isn't at all surprising — any number of social factors would contribute to lower reporting on weekends — but the fact that it's not flat across mid-week is a little surprising to me, and I've seen too many people (albeit few experts) taking weekend dips as signs that things are on the downswing. Has this variance been studied in other medical reporting and is it worth compensating for or smoothing in situations like this where decisions are (rightly or wrongly) sometimes being made on a literal day-by-day basis?
-
There's probably too much geographic variance in these reporting trends to easily account for it. It's a good question, though.– Bryan Krause ♦Commented Apr 27, 2020 at 17:11
-
1It also needs a link. Testing rates drop off in the weekend here and it may do elsewhere as well.– Graham ChiuCommented Apr 27, 2020 at 21:26
-
I think the CDC aggregates data weekly (e.g. fluNet) for a reason, probably something like that medicalsciences.stackexchange.com/questions/23275/… (Also the WH recommendations for reopening involve a two weeks window [of the same data].) I'm not sure [from your q] who decides on a day-by-day basis and what. EuroMOMO also aggregates weekly (they report all deaths, not covid).– got trolled too much this weekCommented Apr 27, 2020 at 22:02
-
@GrahamChiu When you say 'needs a link', can you be more specific?– Steven StadnickiCommented Apr 27, 2020 at 22:37
-
A link to your claims. We can't be expected to google your claims.– Graham ChiuCommented Apr 27, 2020 at 22:44
2 Answers
Seasonal and cyclical effects have been studied prior to COVID-19, including day-of-week influences on Emergency Department visit volume.
For example, in a study of emergency departments in Western New York:
“The final ARMA (2,0) model indicated an autoregressive structure with up to a 2-day lag. ED volume is lower on weekends than on weekdays, and the highest volumes are on Mondays. Summer and fall seasons demonstrated higher volumes, whereas lower volume outliers were associated with holidays.”
Factoring this effect is likely important to understanding the baseline expected volume, and its cyclicity. Other methods include looking at visit volume for plausibly UN-related reasons, eg diarrheal illness, to understand a baseline cycle in ER visits even during a pandemic when care-seeking behavior may change from original cycles.
-
+1 Interesting that the highest volume on Monday (for ER) seems to jibe with the finding from the ILI paper I found. Commented May 10, 2020 at 17:06
I haven't seen a lot of research on these intra-weekly (reporting) trends on anything health-related, but there is one paper on such trend on ILI reporting, alas just in the military:
In this report, we describe and analyze a periodic pattern in influenza-like illness within active military populations, derived from the Defense Medical Surveillance System data set. We find that there is a well-defined pattern with peak incidence on Monday, decaying to Friday, and remaining roughly constant over the weekend. Moreover, we find that the pattern systematically changes in response to public holidays. We quantitatively describe the effect of this modulation, and show how these results may be used to detrend military and, by extension, civilian data sets. As medical data streams become more timely, these results may be used to infer near-real-time daily estimates of influenza-like illness incidence, which may form the basis of a forecasting tool for imminent outbreaks.
Note that this is a very large data set (n > 1 million observations.)
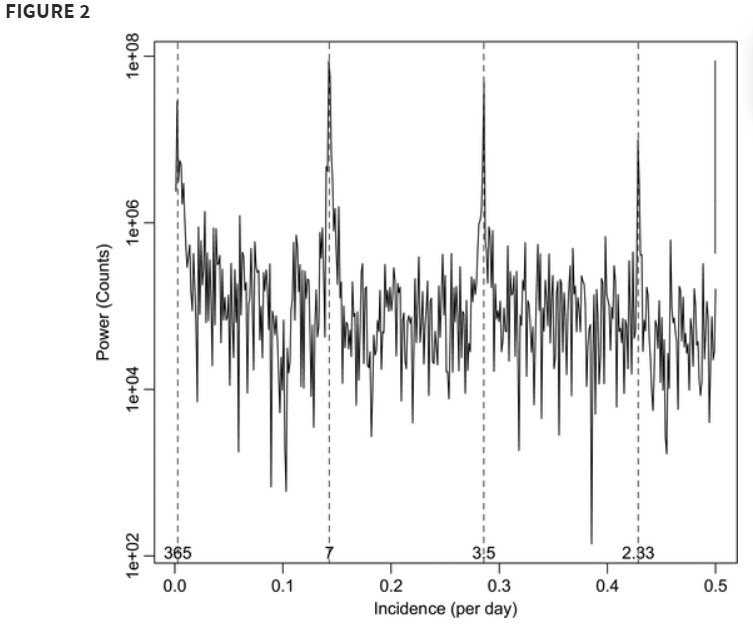
A power spectrum of incidence measurements quantifies how the variance in the data is distributed over the frequency components into which that data can be decomposed. In other words, it is a measure of the energy per unit time falling within different frequency bins. For our purposes, it indicates where periodicities in the data may be found. The Nyquist frequency corresponds to 1/2 t, which because the data are daily averages, corresponds to 0.5 day−1. The four major peaks, which are marked by the dashed lines, correspond to periods of 1 year, 7 days, 3.5 days, and 2.33 days. The latter two frequencies are merely harmonics of the fundamental 7-day period.
So a weekly [reporting] pattern (for Covid-19) doesn't seem so unusual in this perspective.
The paper is a bit more complicated than this as they looked at the intra-week patterns for two different definitions of ILI. For the more strict definition, the was less intra-week variation.
They have some conclusions based on that:
It is also important to acknowledge that these data reflect attendance at the clinic and not onset of symptoms. It is unlikely that onset data would display any strong intra-weekly variations, although a modest modulation may be possible because of behavioral changes during a typical week. [...]
Our results illustrate that the renormalization kernel is data set specific. [...] because of the notable difference in the kernels on Sundays, we suggest that the disease too plays a role. The subset of ILI-large cases that we also identified as ILI-small represents a group who were displaying more severe respiratory problems. Therefore, it is likely that these individuals could not wait until Monday before seeing a medical professional. Moreover, with an average latency period of approximately 1.6 days, patients with influenza who became infected on Thursday or Friday would not recognize their symptoms as severe for another day, forcing them to seek treatment on Sunday.
