Commonmark migration
Source Link

I haven't seen a lot of research on these intra-weekly (reporting) trends on anything health-related, but there is one paper on such trend on ILI reporting, alas just in the military:

In this report, we describe and analyze a periodic pattern in influenza-like illness within active military populations, derived from the Defense Medical Surveillance System data set. We find that there is a well-defined pattern with peak incidence on Monday, decaying to Friday, and remaining roughly constant over the weekend. Moreover, we find that the pattern systematically changes in response to public holidays. We quantitatively describe the effect of this modulation, and show how these results may be used to detrend military and, by extension, civilian data sets. As medical data streams become more timely, these results may be used to infer near-real-time daily estimates of influenza-like illness incidence, which may form the basis of a forecasting tool for imminent outbreaks.

Note that this is a very large data set (n > 1 million observations.)

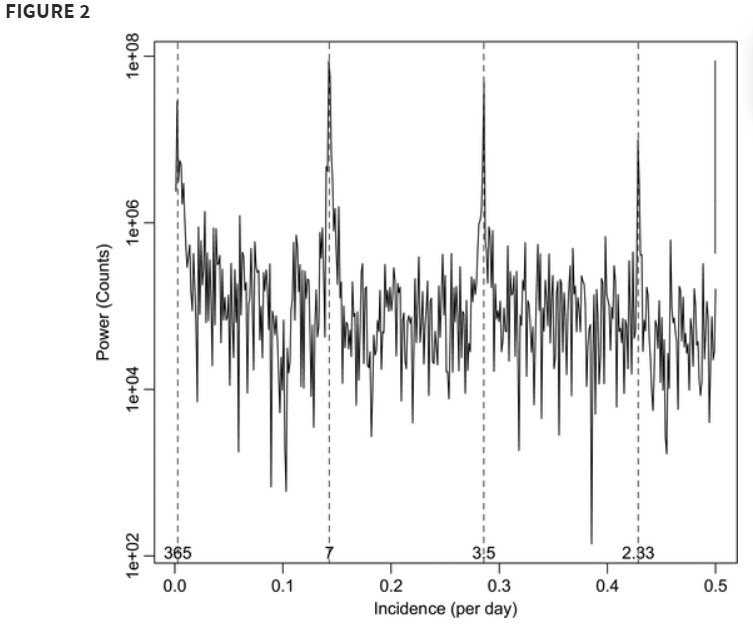
A power spectrum of incidence measurements quantifies how the variance in the data is distributed over the frequency components into which that data can be decomposed. In other words, it is a measure of the energy per unit time falling within different frequency bins. For our purposes, it indicates where periodicities in the data may be found. The Nyquist frequency corresponds to 1/2 t, which because the data are daily averages, corresponds to 0.5 day−1. The four major peaks, which are marked by the dashed lines, correspond to periods of 1 year, 7 days, 3.5 days, and 2.33 days. The latter two frequencies are merely harmonics of the fundamental 7-day period.


enter image description here

So a weekly [reporting] pattern (for Covid-19) doesn't seem so unusual in this perspective.

The paper is a bit more complicated than this as they looked at the intra-week patterns for two different definitions of ILI. For the more strict definition, the was less intra-week variation.

They have some conclusions based on that:

It is also important to acknowledge that these data reflect attendance at the clinic and not onset of symptoms. It is unlikely that onset data would display any strong intra-weekly variations, although a modest modulation may be possible because of behavioral changes during a typical week. [...]


Our results illustrate that the renormalization kernel is data set specific. [...] because of the notable difference in the kernels on Sundays, we suggest that the disease too plays a role. The subset of ILI-large cases that we also identified as ILI-small represents a group who were displaying more severe respiratory problems. Therefore, it is likely that these individuals could not wait until Monday before seeing a medical professional. Moreover, with an average latency period of approximately 1.6 days, patients with influenza who became infected on Thursday or Friday would not recognize their symptoms as severe for another day, forcing them to seek treatment on Sunday.

I haven't seen a lot of research on these intra-weekly (reporting) trends on anything health-related, but there is one paper on such trend on ILI reporting, alas just in the military:

In this report, we describe and analyze a periodic pattern in influenza-like illness within active military populations, derived from the Defense Medical Surveillance System data set. We find that there is a well-defined pattern with peak incidence on Monday, decaying to Friday, and remaining roughly constant over the weekend. Moreover, we find that the pattern systematically changes in response to public holidays. We quantitatively describe the effect of this modulation, and show how these results may be used to detrend military and, by extension, civilian data sets. As medical data streams become more timely, these results may be used to infer near-real-time daily estimates of influenza-like illness incidence, which may form the basis of a forecasting tool for imminent outbreaks.

Note that this is a very large data set (n > 1 million observations.)

A power spectrum of incidence measurements quantifies how the variance in the data is distributed over the frequency components into which that data can be decomposed. In other words, it is a measure of the energy per unit time falling within different frequency bins. For our purposes, it indicates where periodicities in the data may be found. The Nyquist frequency corresponds to 1/2 t, which because the data are daily averages, corresponds to 0.5 day−1. The four major peaks, which are marked by the dashed lines, correspond to periods of 1 year, 7 days, 3.5 days, and 2.33 days. The latter two frequencies are merely harmonics of the fundamental 7-day period.

enter image description here

So a weekly [reporting] pattern (for Covid-19) doesn't seem so unusual in this perspective.

The paper is a bit more complicated than this as they looked at the intra-week patterns for two different definitions of ILI. For the more strict definition, the was less intra-week variation.

They have some conclusions based on that:

It is also important to acknowledge that these data reflect attendance at the clinic and not onset of symptoms. It is unlikely that onset data would display any strong intra-weekly variations, although a modest modulation may be possible because of behavioral changes during a typical week. [...]

Our results illustrate that the renormalization kernel is data set specific. [...] because of the notable difference in the kernels on Sundays, we suggest that the disease too plays a role. The subset of ILI-large cases that we also identified as ILI-small represents a group who were displaying more severe respiratory problems. Therefore, it is likely that these individuals could not wait until Monday before seeing a medical professional. Moreover, with an average latency period of approximately 1.6 days, patients with influenza who became infected on Thursday or Friday would not recognize their symptoms as severe for another day, forcing them to seek treatment on Sunday.

Bounty Ended with 100 reputation awarded by iggy
added 624 characters in body
Source Link

I haven't seen a lot of research on these intra-weekly (reporting) trends on anything health-related, but there is one paper on such trend on ILI reporting, alas just in the military:

In this report, we describe and analyze a periodic pattern in influenza-like illness within active military populations, derived from the Defense Medical Surveillance System data set. We find that there is a well-defined pattern with peak incidence on Monday, decaying to Friday, and remaining roughly constant over the weekend. Moreover, we find that the pattern systematically changes in response to public holidays. We quantitatively describe the effect of this modulation, and show how these results may be used to detrend military and, by extension, civilian data sets. As medical data streams become more timely, these results may be used to infer near-real-time daily estimates of influenza-like illness incidence, which may form the basis of a forecasting tool for imminent outbreaks.

Note that this is a very large data set (n > 1 million observations.)

A power spectrum of incidence measurements quantifies how the variance in the data is distributed over the frequency components into which that data can be decomposed. In other words, it is a measure of the energy per unit time falling within different frequency bins. For our purposes, it indicates where periodicities in the data may be found. The Nyquist frequency corresponds to 1/2 t, which because the data are daily averages, corresponds to 0.5 day−1. The four major peaks, which are marked by the dashed lines, correspond to periods of 1 year, 7 days, 3.5 days, and 2.33 days. The latter two frequencies are merely harmonics of the fundamental 7-day period.

enter image description here

So a weekly [reporting] pattern (for Covid-19) doesn't seem so unusual in this perspective.

The paper is a bit more complicated than this as they looked at the intra-week patterns for two different definitions of ILI. For the more strict definition, the was less intra-week variation.

They have some conclusions based on that:

It is also important to acknowledge that these data reflect attendance at the clinic and not onset of symptoms. It is unlikely that onset data would display any strong intra-weekly variations, although a modest modulation may be possible because of behavioral changes during a typical week. [...]

Our results illustrate that the renormalization kernel is data set specific. [...] because of the notable difference in the kernels on Sundays, we suggest that the disease too plays a role. The subset of ILI-large cases that we also identified as ILI-small represents a group who were displaying more severe respiratory problems. Therefore, it is likely that these individuals could not wait until Monday before seeing a medical professional. Moreover, with an average latency period of approximately 1.6 days, patients with influenza who became infected on Thursday or Friday would not recognize their symptoms as severe for another day, forcing them to seek treatment on Sunday.

I haven't seen a lot of research on these intra-weekly (reporting) trends on anything health-related, but there is one paper on such trend on ILI reporting, alas just in the military:

In this report, we describe and analyze a periodic pattern in influenza-like illness within active military populations, derived from the Defense Medical Surveillance System data set. We find that there is a well-defined pattern with peak incidence on Monday, decaying to Friday, and remaining roughly constant over the weekend. Moreover, we find that the pattern systematically changes in response to public holidays. We quantitatively describe the effect of this modulation, and show how these results may be used to detrend military and, by extension, civilian data sets. As medical data streams become more timely, these results may be used to infer near-real-time daily estimates of influenza-like illness incidence, which may form the basis of a forecasting tool for imminent outbreaks.

Note that this is a very large data set (n > 1 million observations.)

A power spectrum of incidence measurements quantifies how the variance in the data is distributed over the frequency components into which that data can be decomposed. In other words, it is a measure of the energy per unit time falling within different frequency bins. For our purposes, it indicates where periodicities in the data may be found. The Nyquist frequency corresponds to 1/2 t, which because the data are daily averages, corresponds to 0.5 day−1. The four major peaks, which are marked by the dashed lines, correspond to periods of 1 year, 7 days, 3.5 days, and 2.33 days. The latter two frequencies are merely harmonics of the fundamental 7-day period.

enter image description here

So a weekly [reporting] pattern (for Covid-19) doesn't so unusual in this perspective.

I haven't seen a lot of research on these intra-weekly (reporting) trends on anything health-related, but there is one paper on such trend on ILI reporting, alas just in the military:

In this report, we describe and analyze a periodic pattern in influenza-like illness within active military populations, derived from the Defense Medical Surveillance System data set. We find that there is a well-defined pattern with peak incidence on Monday, decaying to Friday, and remaining roughly constant over the weekend. Moreover, we find that the pattern systematically changes in response to public holidays. We quantitatively describe the effect of this modulation, and show how these results may be used to detrend military and, by extension, civilian data sets. As medical data streams become more timely, these results may be used to infer near-real-time daily estimates of influenza-like illness incidence, which may form the basis of a forecasting tool for imminent outbreaks.

Note that this is a very large data set (n > 1 million observations.)

A power spectrum of incidence measurements quantifies how the variance in the data is distributed over the frequency components into which that data can be decomposed. In other words, it is a measure of the energy per unit time falling within different frequency bins. For our purposes, it indicates where periodicities in the data may be found. The Nyquist frequency corresponds to 1/2 t, which because the data are daily averages, corresponds to 0.5 day−1. The four major peaks, which are marked by the dashed lines, correspond to periods of 1 year, 7 days, 3.5 days, and 2.33 days. The latter two frequencies are merely harmonics of the fundamental 7-day period.

enter image description here

So a weekly [reporting] pattern (for Covid-19) doesn't seem so unusual in this perspective.

The paper is a bit more complicated than this as they looked at the intra-week patterns for two different definitions of ILI. For the more strict definition, the was less intra-week variation.

They have some conclusions based on that:

It is also important to acknowledge that these data reflect attendance at the clinic and not onset of symptoms. It is unlikely that onset data would display any strong intra-weekly variations, although a modest modulation may be possible because of behavioral changes during a typical week. [...]

Our results illustrate that the renormalization kernel is data set specific. [...] because of the notable difference in the kernels on Sundays, we suggest that the disease too plays a role. The subset of ILI-large cases that we also identified as ILI-small represents a group who were displaying more severe respiratory problems. Therefore, it is likely that these individuals could not wait until Monday before seeing a medical professional. Moreover, with an average latency period of approximately 1.6 days, patients with influenza who became infected on Thursday or Friday would not recognize their symptoms as severe for another day, forcing them to seek treatment on Sunday.

added 766 characters in body
Source Link

I haven't seen a lot of research on these intra-weekly (reporting) trends on anything health-related, but there is one paper on such trend on ILI reporting, alas just in the military:

In this report, we describe and analyze a periodic pattern in influenza-like illness within active military populations, derived from the Defense Medical Surveillance System data set. We find that there is a well-defined pattern with peak incidence on Monday, decaying to Friday, and remaining roughly constant over the weekend. Moreover, we find that the pattern systematically changes in response to public holidays. We quantitatively describe the effect of this modulation, and show how these results may be used to detrend military and, by extension, civilian data sets. As medical data streams become more timely, these results may be used to infer near-real-time daily estimates of influenza-like illness incidence, which may form the basis of a forecasting tool for imminent outbreaks.

Note that this is a very large data set (n > 1 million observations.)

A power spectrum of incidence measurements quantifies how the variance in the data is distributed over the frequency components into which that data can be decomposed. In other words, it is a measure of the energy per unit time falling within different frequency bins. For our purposes, it indicates where periodicities in the data may be found. The Nyquist frequency corresponds to 1/2 t, which because the data are daily averages, corresponds to 0.5 day−1. The four major peaks, which are marked by the dashed lines, correspond to periods of 1 year, 7 days, 3.5 days, and 2.33 days. The latter two frequencies are merely harmonics of the fundamental 7-day period.

enter image description here

So a weekly [reporting] pattern (for Covid-19) doesn't so unusual in this perspective.

I haven't seen a lot of research on these intra-weekly (reporting) trends on anything health-related, but there is one paper on such trend on ILI reporting, alas just in the military:

In this report, we describe and analyze a periodic pattern in influenza-like illness within active military populations, derived from the Defense Medical Surveillance System data set. We find that there is a well-defined pattern with peak incidence on Monday, decaying to Friday, and remaining roughly constant over the weekend. Moreover, we find that the pattern systematically changes in response to public holidays. We quantitatively describe the effect of this modulation, and show how these results may be used to detrend military and, by extension, civilian data sets. As medical data streams become more timely, these results may be used to infer near-real-time daily estimates of influenza-like illness incidence, which may form the basis of a forecasting tool for imminent outbreaks.

Note that this is a very large data set (n > 1 million observations.)

A power spectrum of incidence measurements quantifies how the variance in the data is distributed over the frequency components into which that data can be decomposed. In other words, it is a measure of the energy per unit time falling within different frequency bins. For our purposes, it indicates where periodicities in the data may be found. The Nyquist frequency corresponds to 1/2 t, which because the data are daily averages, corresponds to 0.5 day−1. The four major peaks, which are marked by the dashed lines, correspond to periods of 1 year, 7 days, 3.5 days, and 2.33 days. The latter two frequencies are merely harmonics of the fundamental 7-day period.

enter image description here

So a weekly [reporting] pattern (for Covid-19) doesn't so unusual in this perspective.

Source Link
Loading